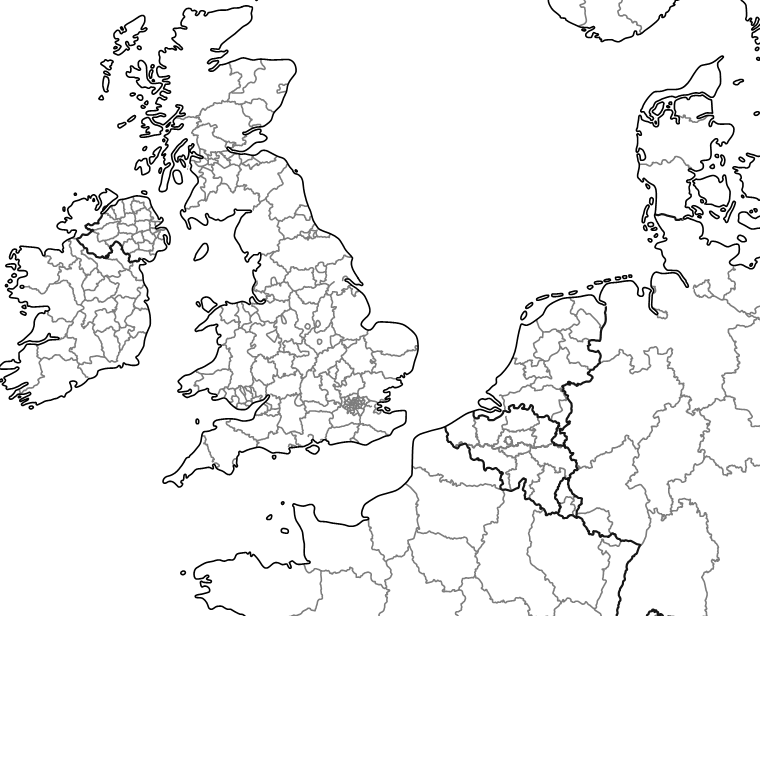
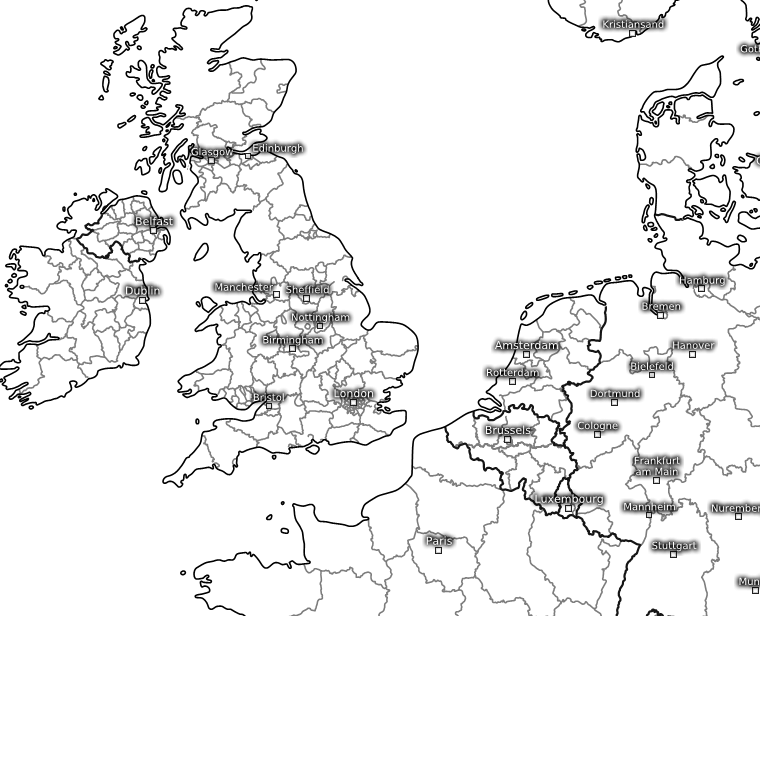
Grid map 0.6 E, 53.2 N (Zoom level 2 / Resolution 1.2mi)
Pressure tendency, 3h (1/10mbar)
Loading
Stationsname
00°C
Gemeldet um 12:00 Uhr
Station
°C
Reported at 12:00 Uhr
Pressure tendency, 3h
This map displays the observed change in air pressure over a period of 3 hours. Use this to see if low or high pressure centers are strengthening or weakening as well as where they’re moving. Areas of falling pressures generally have increasingly inclement weather as they indicate the approach of a low pressure system while rising pressures indicates improving weather as a high pressure system is on the way.